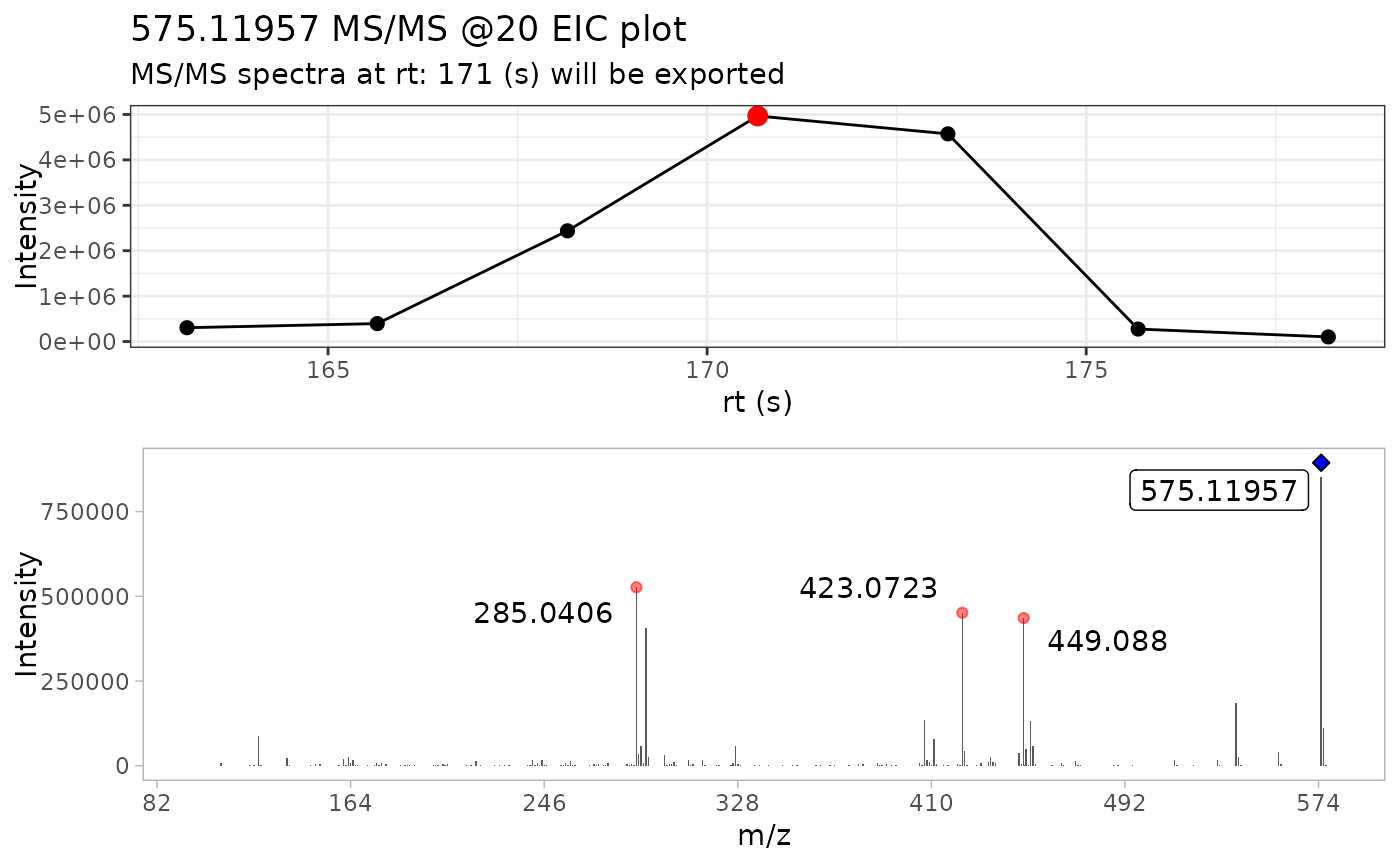
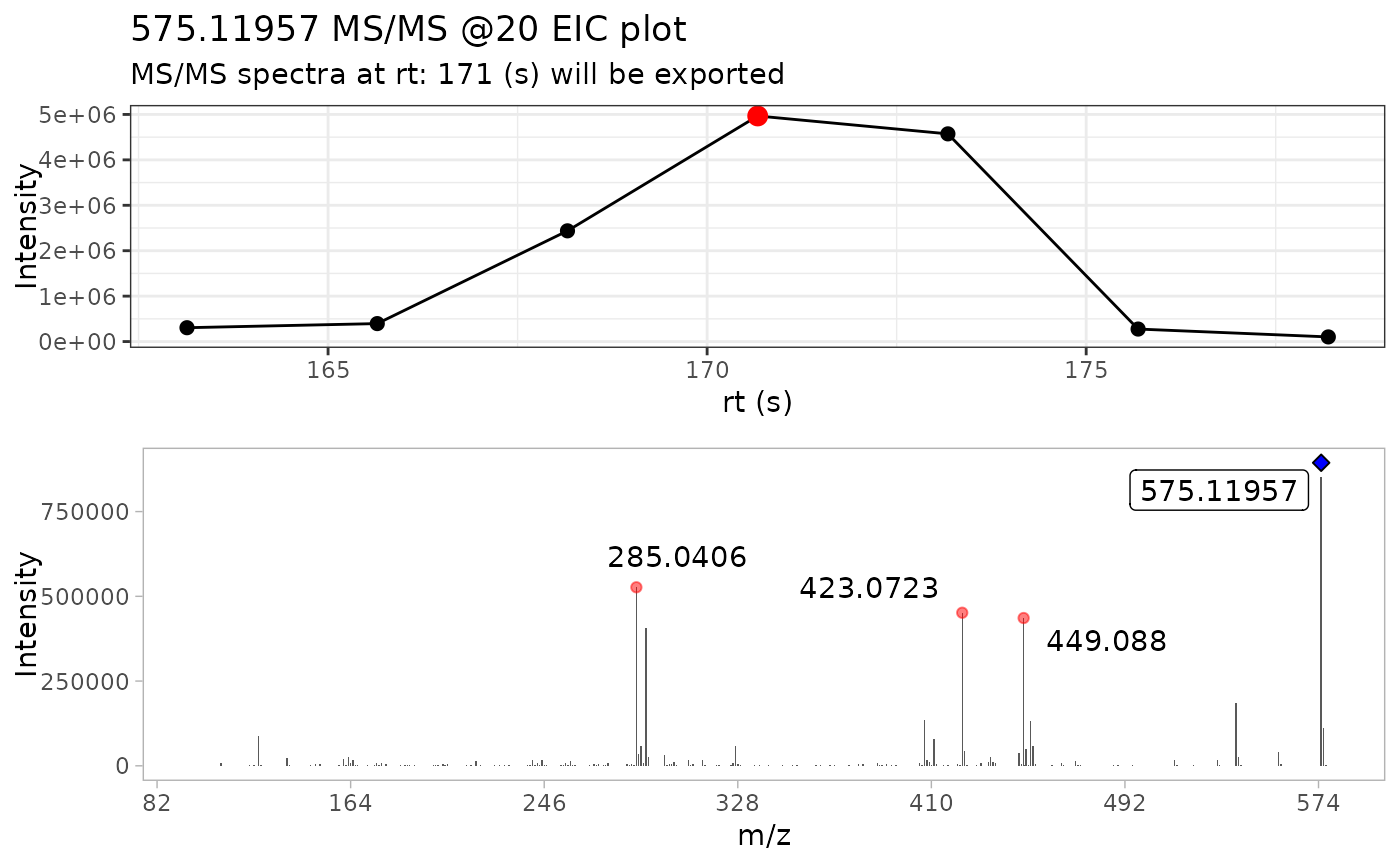
This function takes a series of MS/MS spectra, selects the most intense scan and extracts the MS/MS spectra from it. Additionally, it plots the MS/MS EIC chromatogram and colors the most intense scan with red circle, and the precursor ion with a blue diamond
Arguments
- spec
a data frame with the MS/MS spectra
- verbose
a boolean indicating if the MS/MS EIC chromatogram is displayed
- out_list
a boolean expressing if the output is a list containing the MS/MS spectra plus the EIC chromatogram (verbose = TRUE), or only the data frame with the MS/MS spectra (verbose = FALSE).
Examples
# Importing the Spectrum of Procyanidin A2 in negative ionzation mode
# and 20 eV as the collision energy
ProcA2_file <- system.file("extdata",
  "ProcyanidinA2_neg_20eV.mzXML",
  package = "MS2extract"
)

# Region of interest table (rt in seconds)
ProcA2_data <- data.frame(
  Formula = "C30H24O12", Ionization_mode = "Negative",
  min_rt = 163, max_rt = 180
)
# Importing MS/MS data
ProcA2_raw <- import_mzxml(ProcA2_file, ProcA2_data)
#> • Processing: ProcyanidinA2_neg_20eV.mzXML
#> • Found 1 CE value: 20
#> • Remember to match CE velues in spec_metadata when exporting your library
#> • m/z range given 10 ppm: 575.11376 and 575.12526

# Extracting most intense scan ----
# Returning plot + MS2 spectra
extract_MS2(ProcA2_raw)
#> Scale for x is already present.
#> Adding another scale for x, which will replace the existing scale.
#> Warning: `position_stack()` requires non-overlapping x intervals.

#> # A tibble: 4,561 × 6
#> # Groups:   Formula, CE [1]
#>       mz intensity mz_precursor    rt    CE Formula
#>    <dbl>     <dbl>        <dbl> <dbl> <dbl> <chr>
#>  1  100.      40.1         575.  171.    20 C30H24O12
#>  2  100.      23.3         575.  171.    20 C30H24O12
#>  3  100.      15.8         575.  171.    20 C30H24O12
#>  4  101.     255.          575.  171.    20 C30H24O12
#>  5  101.      11           575.  171.    20 C30H24O12
#>  6  102.      91.5         575.  171.    20 C30H24O12
#>  7  103.       9           575.  171.    20 C30H24O12
#>  8  104.      21.2         575.  171.    20 C30H24O12
#>  9  104.      91.1         575.  171.    20 C30H24O12
#> 10  104.      14.7         575.  171.    20 C30H24O12
#> # ℹ 4,551 more rows

# Returning MS/MS spectra only
extract_MS2(ProcA2_raw, out_list = FALSE)
#> Scale for x is already present.
#> Adding another scale for x, which will replace the existing scale.
#> Warning: `position_stack()` requires non-overlapping x intervals.

#> # A tibble: 4,561 × 6
#> # Groups:   Formula, CE [1]
#>       mz intensity mz_precursor    rt    CE Formula
#>    <dbl>     <dbl>        <dbl> <dbl> <dbl> <chr>
#>  1  100.      40.1         575.  171.    20 C30H24O12
#>  2  100.      23.3         575.  171.    20 C30H24O12
#>  3  100.      15.8         575.  171.    20 C30H24O12
#>  4  101.     255.          575.  171.    20 C30H24O12
#>  5  101.      11           575.  171.    20 C30H24O12
#>  6  102.      91.5         575.  171.    20 C30H24O12
#>  7  103.       9           575.  171.    20 C30H24O12
#>  8  104.      21.2         575.  171.    20 C30H24O12
#>  9  104.      91.1         575.  171.    20 C30H24O12
#> 10  104.      14.7         575.  171.    20 C30H24O12
#> # ℹ 4,551 more rows