A wrapper function to calculate the cosine similarity score between two spectra.
This function selects the m/z and intensity columns before parsing
the data frames to SpectrumSimilarity.
Arguments
- spec1
a data frame containing spectra info.
- spec2
a data frame containing spectra info.
- output.list
a boolean, if TRUE the output is returned as a list
- ...
arguments parsed to
SpectrumSimilarity.
Examples
# Importing the Spectrum of Procyanidin A2 in negative ionization mode
# and 20 eV as the collision energy
ProcA2_file <- system.file("extdata",
"ProcyanidinA2_neg_20eV.mzXML",
package = "MS2extract"
)
# Importing the MS2 of Procyanidin A2 deconvoluted by PCDL (Agilent)
ProcA2_pcdl_fl <- system.file("extdata",
"ProcA2_neg_20eV_PCDL.csv",
package = "MS2extract"
)
# Region of interest table (rt in seconds)
ProcA2_data <- data.frame(
Formula = "C30H24O12", Ionization_mode = "Negative",
min_rt = 163, max_rt = 180
)
# Reading the Procyanidin A2 spectra
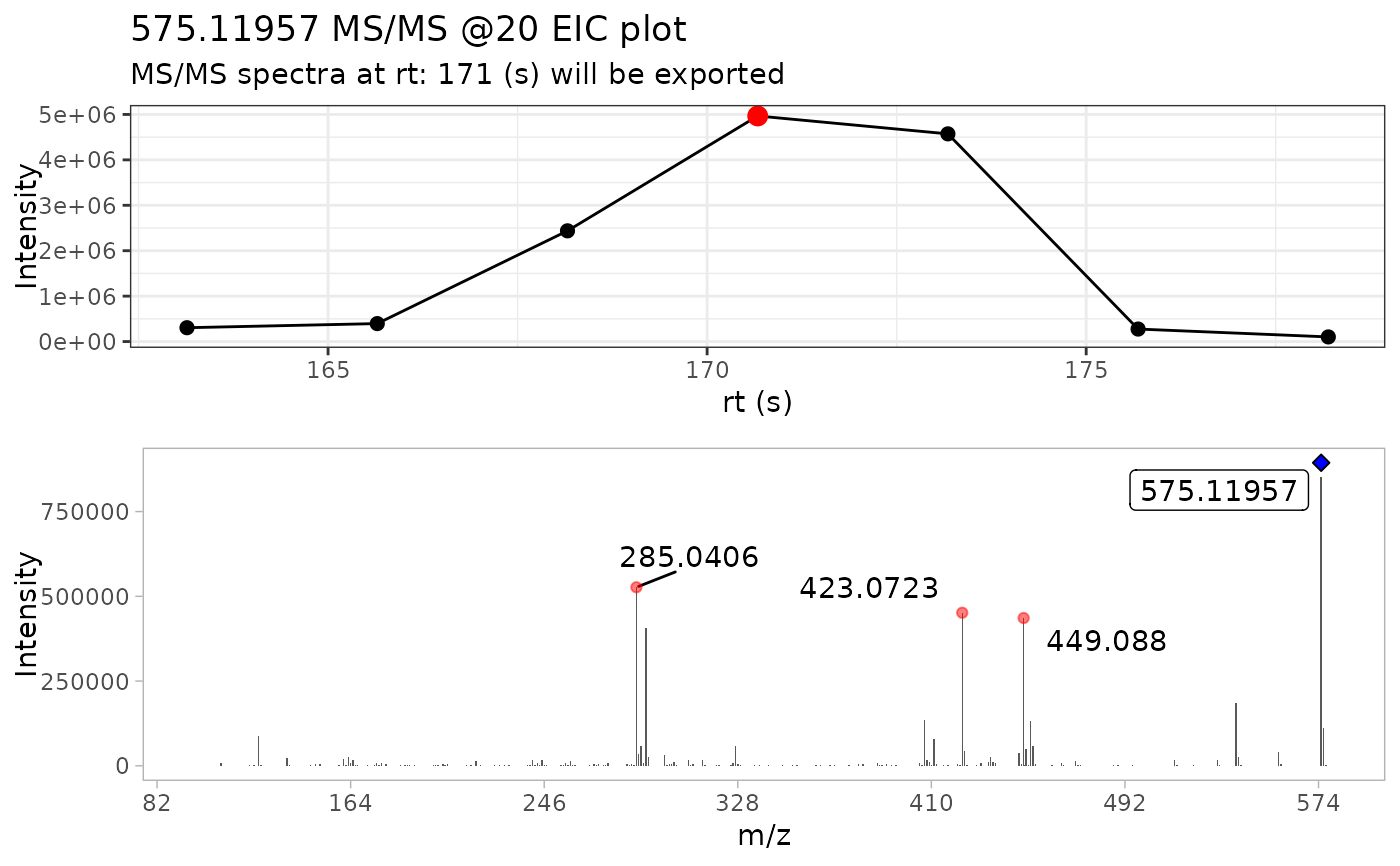
ProcA2_raw <- import_mzxml(ProcA2_file, ProcA2_data)
#> • Processing: ProcyanidinA2_neg_20eV.mzXML
#> • Found 1 CE value: 20
#> • Remember to match CE velues in spec_metadata when exporting your library
#> • m/z range given 10 ppm: 575.11376 and 575.12526
# Extracting the most instense MS2 spectra
ProcA2_extracted <- extract_MS2(ProcA2_raw, out_list = FALSE)
#> Scale for x is already present.
#> Adding another scale for x, which will replace the existing scale.
#> Warning: `position_stack()` requires non-overlapping x intervals.
 # Detecting masses
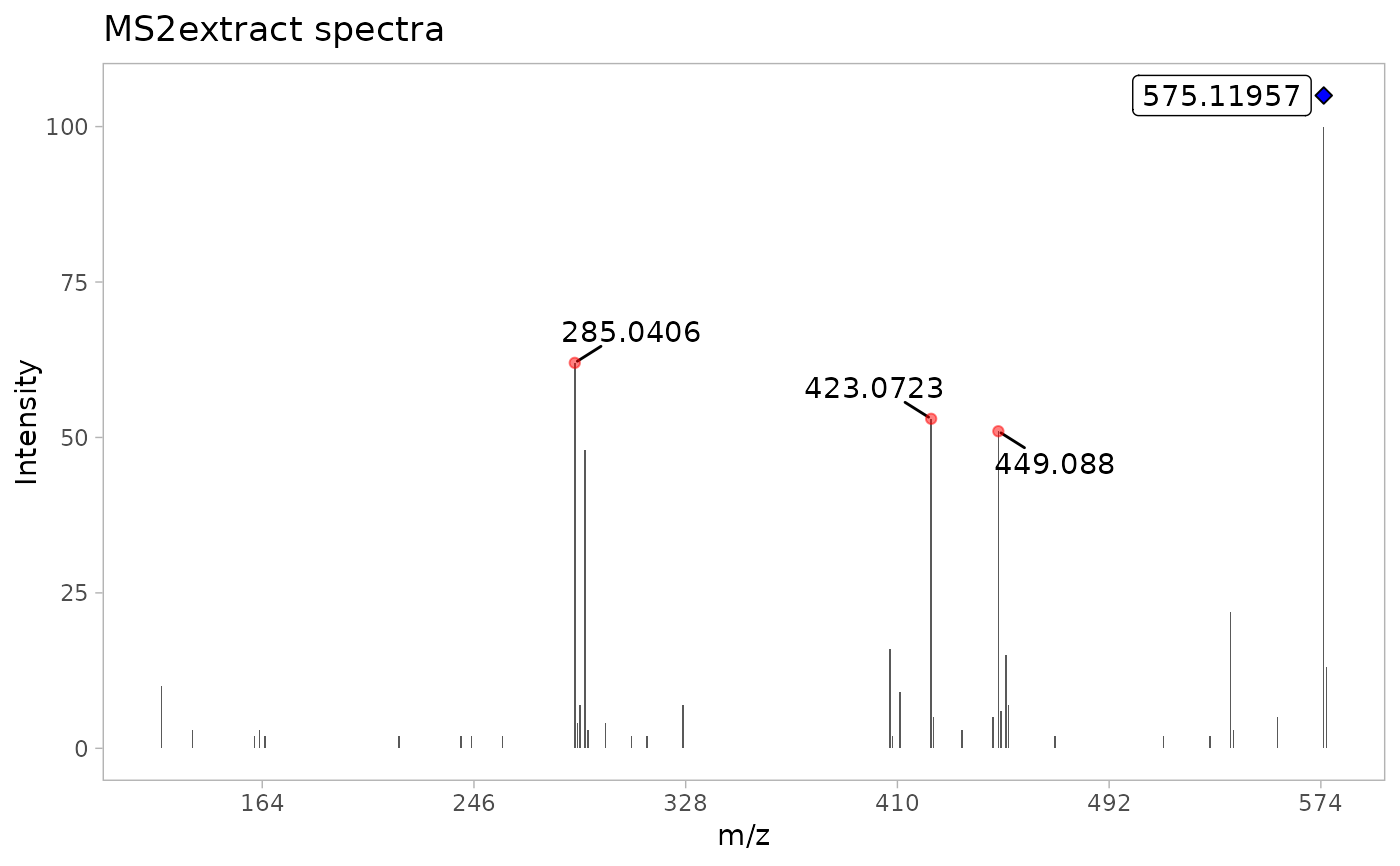
ProcA2_norm <- detect_mass(ProcA2_extracted, normalize = TRUE, min_int = 1)
# Plot of the resulting reference MS2 spectra using MS2extract
plot_MS2spectra(ProcA2_norm) +
ggplot2::labs(title = "MS2extract spectra")
#> Scale for x is already present.
#> Adding another scale for x, which will replace the existing scale.
#> Warning: `position_stack()` requires non-overlapping x intervals.
# Detecting masses
ProcA2_norm <- detect_mass(ProcA2_extracted, normalize = TRUE, min_int = 1)
# Plot of the resulting reference MS2 spectra using MS2extract
plot_MS2spectra(ProcA2_norm) +
ggplot2::labs(title = "MS2extract spectra")
#> Scale for x is already present.
#> Adding another scale for x, which will replace the existing scale.
#> Warning: `position_stack()` requires non-overlapping x intervals.
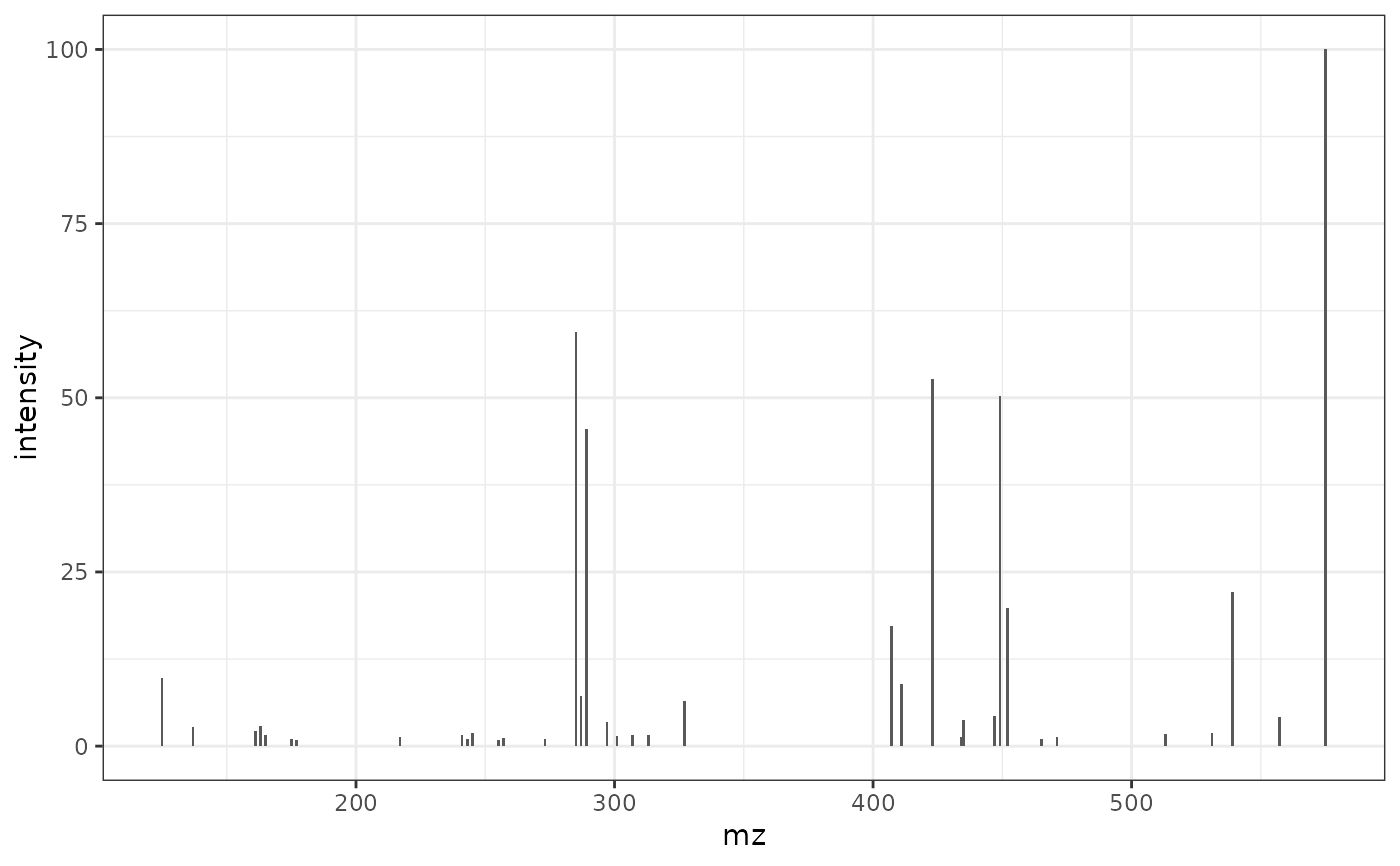
 # Reading the MS2 spectra of Procynidin A2 by PCDL
ProcA2_PCDL <- read.csv(ProcA2_pcdl_fl)
# Plot of the reference MS2 spectra using PCDL (Agilent software)
ggplot2::ggplot(ProcA2_PCDL, ggplot2::aes(mz, intensity)) +
ggplot2::geom_col(width = 1) +
ggplot2::theme_bw()
#> Warning: `position_stack()` requires non-overlapping x intervals.
# Reading the MS2 spectra of Procynidin A2 by PCDL
ProcA2_PCDL <- read.csv(ProcA2_pcdl_fl)
# Plot of the reference MS2 spectra using PCDL (Agilent software)
ggplot2::ggplot(ProcA2_PCDL, ggplot2::aes(mz, intensity)) +
ggplot2::geom_col(width = 1) +
ggplot2::theme_bw()
#> Warning: `position_stack()` requires non-overlapping x intervals.
 # Cosine comparison between MS2extract and PCDL MS2 spectra
compare_spectra(ProcA2_norm, ProcA2_PCDL)
# Cosine comparison between MS2extract and PCDL MS2 spectra
compare_spectra(ProcA2_norm, ProcA2_PCDL)
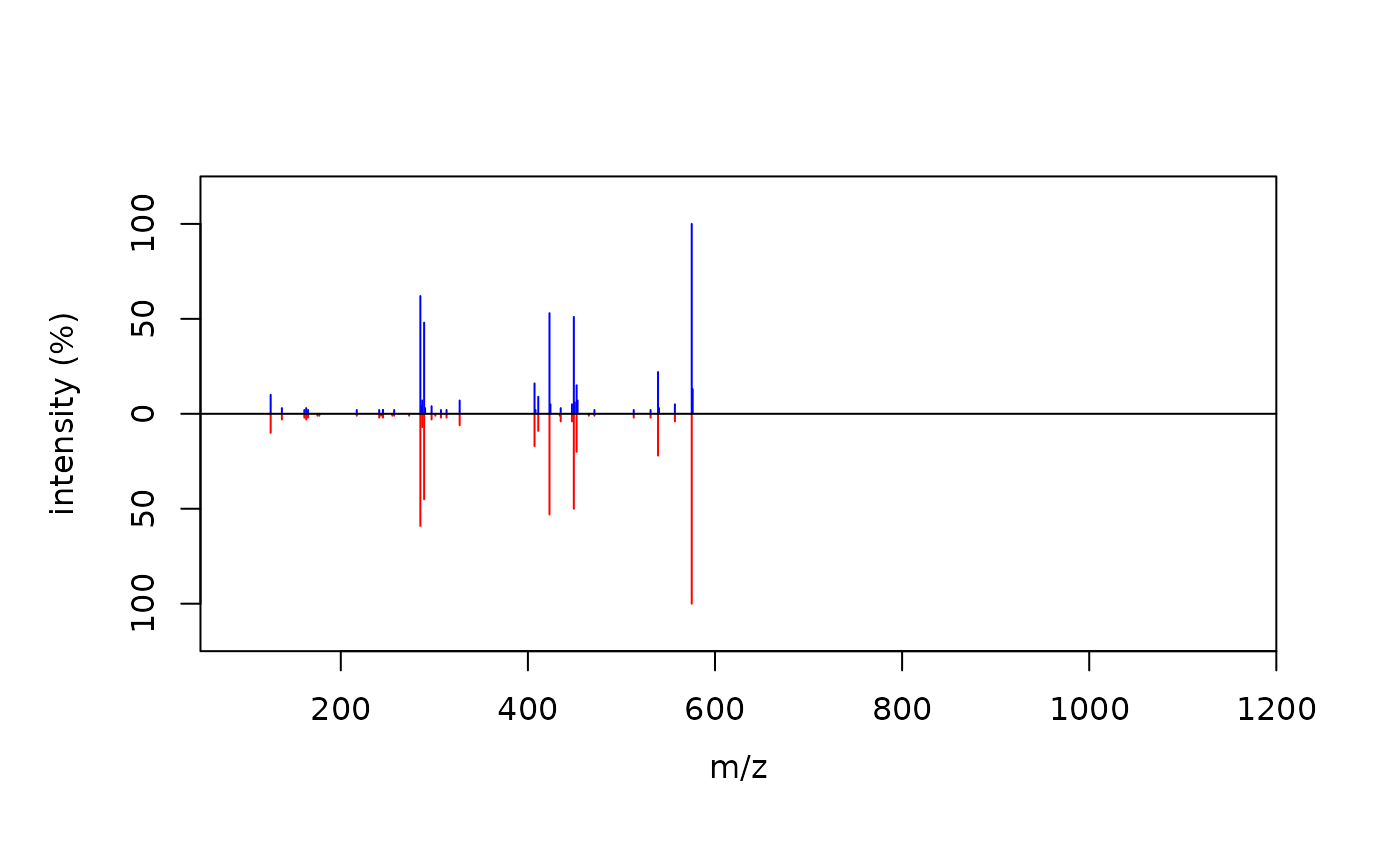 #> $similarity.score
#> [1] 0.9953542
#>
#> $alignment
#> mz intensity.top intensity.bottom
#> 1 125.0242 10 10
#> 2 285.0405 62 59
#> 3 289.0716 48 45
#> 4 407.0767 16 17
#> 5 423.0720 53 53
#> 6 449.0876 51 50
#> 7 452.0742 15 20
#> 8 539.0978 22 22
#> 9 575.1195 100 100
#> 10 576.1221 13 0
#>
#> $plot
#> gTree[GRID.gTree.609]
#>
#> $similarity.score
#> [1] 0.9953542
#>
#> $alignment
#> mz intensity.top intensity.bottom
#> 1 125.0242 10 10
#> 2 285.0405 62 59
#> 3 289.0716 48 45
#> 4 407.0767 16 17
#> 5 423.0720 53 53
#> 6 449.0876 51 50
#> 7 452.0742 15 20
#> 8 539.0978 22 22
#> 9 575.1195 100 100
#> 10 576.1221 13 0
#>
#> $plot
#> gTree[GRID.gTree.609]
#>